
Stroke and the Geography of Survival: When Your ZIP Code Becomes a Risk Factor
- Jun 10
- 7 min read

A stroke does not care where its patient lives. The healthcare system, the available infrastructure, and the evidence base built around them often do.
Stroke is one of the most preventable and treatable major diseases in modern medicine. Acute interventions — intravenous thrombolysis with tPA and tenecteplase, mechanical thrombectomy for large vessel occlusion — have transformed outcomes for eligible patients over the last two decades. Risk-factor management for hypertension, atrial fibrillation, diabetes, and hyperlipidemia can prevent the majority of strokes before they occur. The American Heart Association estimates that up to 80% of strokes are potentially preventable through optimal control of modifiable risk factors.
And yet stroke remains the fifth leading cause of death in the United States and a leading cause of long-term disability, with mortality and outcomes distributed across the population in patterns that biology alone cannot explain. The therapies exist. The question is who reaches them in time, who is offered them when they do, and who lives in a place where the system is built to deliver them at all.
The geography of stroke mortality
The "Stroke Belt" — a cluster of southeastern states first identified in the 1960s — continues to carry a disproportionate share of U.S. stroke deaths more than half a century after the pattern was named. CDC data published in 2024 show stroke death rates among adults aged 45–64 are markedly higher in the South than in any other U.S. region, and the disparity is not subtle.
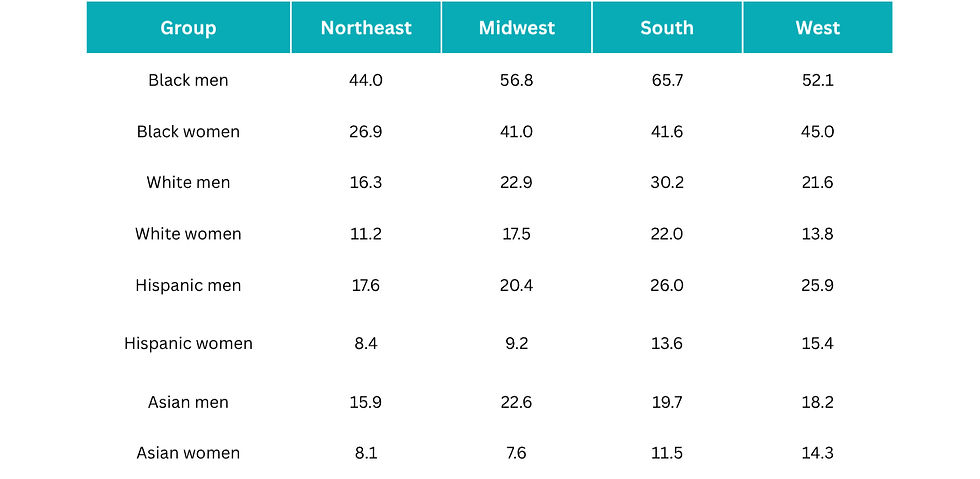
The regional gradient is consistent across every demographic group and most pronounced among Black men, whose stroke death rate in the South reaches 65.7 per 100,000 — roughly 1.5 times the equivalent rate in the Northeast and 2 to 3 times the rates for any other race or ethnicity group of men in any region. CDC NCHS Data Brief No. 505 (2024) The full regional picture appears below.
Table 1. Stroke death rates by U.S. region, race/ethnicity, and sex (ages 45–64 years, death per 100,000 population in 2022)
The geographic pattern persists across decades of intervention. After declining steadily from 2002 to 2012, stroke death rates among working-age adults began rising again through 2021 before a modest decline in 2022 — and the rise was steepest in the regions where rates were already highest. The pattern is not a curiosity. It is a structural feature of how the disease is distributed across the country, and it tracks closely with the prevalence of uncontrolled hypertension, the density of stroke-capable hospitals, and the socioeconomic conditions that shape both.
The racial disparity is not subtle
Within these geographic patterns, racial disparities in stroke mortality are among the most persistent in cardiovascular medicine. Black adults are approximately 45% more likely than White adults to die from stroke, with age-adjusted stroke death rates of 101.6 per 100,000 among Black adults aged 35 and older compared to 69.1 per 100,000 among White adults. Among working-age Black men, stroke death rates are 2 to 3 times higher than rates for any other race or ethnicity group in every U.S. region. For Black women aged 45–64, the gap is even wider — 2 to 5 times higher than rates for women of any other race or ethnicity, depending on region.
A 2025 analysis published in Social Science & Medicine moved beyond describing the disparity to quantifying one of its drivers. The investigators constructed a county-level structural racism score from census-based indicators of racial disproportionality in income, employment, education, home ownership, health insurance, and residential segregation, then linked the score to age-standardized stroke death rates in 935 U.S. counties. They found that each 1-unit increase in the structural racism score was associated with 0.37 additional stroke deaths per 100,000 Black residents relative to White residents, with the association nearly twice as strong among men. The finding offers something the field has often lacked: a measurable, place-based mechanism connecting social structure to a hard clinical endpoint.
The implication for evidence generation is direct. When we describe stroke risk in purely biological terms — hypertension, atrial fibrillation, cholesterol, lifestyle — we capture the proximate causes accurately while missing the upstream conditions that shape who develops those proximate causes in the first place, and at what age, and with what access to treatment.
Acute treatment access remains uneven
The disparities visible in mortality begin upstream, in who receives the interventions known to work. tPA and tenecteplase, when administered within the eligibility window after symptom onset, substantially reduce mortality and long-term disability in ischemic stroke. Mechanical thrombectomy, for patients with large vessel occlusion, can be transformative when performed within the appropriate time frame. The evidence base for both is robust. The distribution of both is not.
Black patients and patients in rural areas consistently receive these interventions at lower rates than White and urban patients, even after adjustment for clinical eligibility. The drivers are layered: stroke-capable hospitals — particularly comprehensive stroke centers equipped for thrombectomy — are clustered in metropolitan areas; emergency medical services protocols and transfer pathways vary widely by region; symptom recognition and time-to-presentation are shaped by health literacy and historical patterns of trust in the healthcare system; and the workforce performing thrombectomy is concentrated geographically in ways that map closely to where stroke mortality is lowest, not highest.
The result is an inversion: the populations that carry the heaviest stroke burden are systematically the populations least likely to live within the time-and-distance envelope where the highest-evidence interventions can be delivered.
The neurodegenerative dimension
What makes stroke a fitting subject for a discussion of neurodegeneration is that the disease does not end at hospital discharge. A growing body of evidence establishes stroke as one of the most consequential — and underappreciated — drivers of long-term cognitive decline and dementia. Frontiers in Stroke
Table 2. Post-stroke cognitive impairment: incidence by time and stroke type

The mechanisms are not exclusively vascular. The reviewed literature identifies neuroinflammation, white matter injury, amyloid-beta accumulation, synaptic dysfunction, and cerebral microbleeds among the proposed pathways connecting acute cerebrovascular events to chronic cognitive decline. Vascular contributions to cognitive impairment and dementia (VCID) increasingly appear not as a separate disease category from Alzheimer's disease but as a substantially overlapping one — with shared risk factors, shared pathology in many patients, and shared therapeutic targets that the field is only beginning to characterize.
This is the connection that makes stroke disparities a neurodegeneration story. A population that experiences stroke earlier, more often, and with less access to acute treatment is also a population that enters the years after stroke with elevated dementia risk, often without the rehabilitation infrastructure, longitudinal cognitive monitoring, or caregiver support to address it. A separate analysis from the REGARDS cohort previously demonstrated that residence in the Stroke Belt is itself associated with elevated incident cognitive impairment, independent of individual stroke history — suggesting the geographic patterns that shape acute stroke outcomes extend their influence into the cognitive trajectories of entire communities.
What this means for evidence generation
Stroke illustrates a tension that runs through much of cardiovascular and neurodegenerative research. The biological understanding of the disease has matured substantially over the last two decades. The acute and preventive therapies are, by any reasonable standard, effective. The remaining gap is not primarily one of discovery. It is one of measurement and distribution — of who is studied, who is reached, and what outcomes are tracked beyond the acute event.
Five questions are worth asking of any evidence program in this space:
Who carries the greatest burden? Where the disease concentrates by geography, race, rurality, and socioeconomic position — and how closely study populations reflect that concentration.
Who receives timely treatment? What proportion of eligible patients receive tPA, tenecteplase, or thrombectomy within the time windows where those interventions are most effective, stratified by the populations carrying the highest burden.
Who is missing from the evidence? Which populations are systematically underrepresented in the clinical trials, registries, and real-world datasets that inform guidelines.
What outcomes matter after survival? Whether cognitive impairment, functional recovery, caregiver burden, and quality of life are being measured with the same rigor as 30-day mortality and acute reperfusion.
How can prevention reduce disparities? Where investment in upstream risk-factor management — particularly blood pressure control in the populations and geographies with the highest stroke burden — produces the largest absolute reductions in incidence.
These are not abstract questions. They are the questions that determine whether the next decade of stroke research closes the gap between what the therapies can do and what they actually do in the populations who need them most.
The next evidence challenge
The clinical picture in stroke is increasingly favorable. Prevention works. Acute treatment works. Rehabilitation works. The bottleneck is no longer scientific. It is the unevenness with which scientific gains translate into outcomes across the populations that make up the United States — and the cognitive consequences of that unevenness, which compound silently in the years after the acute event has passed.
If most strokes are preventable, and the most effective acute treatments have been validated for decades, the question that should anchor the next generation of cerebrovascular and neurodegenerative evidence is not whether the interventions work. It is why their benefits remain so unevenly distributed — and what kind of evidence we need to generate, in which populations, with which outcomes, to change that.
References
Martin SS, Aday AW, Almarzooq ZI, et al. 2024 Heart Disease and Stroke Statistics: A Report of US and Global Data from the American Heart Association. Circulation. 2024.
He S, Park S, Kuklina E, et al. Stroke Mortality Among Black and White Adults Aged ≥35 Years Before and During the COVID-19 Pandemic — United States, 2015–2021. MMWR Morb Mortal Wkly Rep. 2023;72:431–436.
Curtin SC, Garnett MF. Stroke Death Rates Among Adults Ages 45–64 by Region and Race and Hispanic Origin: United States, 2002–2022. NCHS Data Brief No. 505. National Center for Health Statistics. 2024.
Gompers A, Lewis TT, Kramer MR. Structural racism and racial disparities in stroke mortality in the United States, 2021. Soc Sci Med. 2025;366:117705.
Models and mechanisms of post-stroke dementia and cognitive impairment. Frontiers in Stroke. 2025.
Wilson ME, Cushman M, Howard G, et al. Incident cognitive impairment is elevated in the stroke belt: The REGARDS study. Ann Neurol. 2011;70:229–236.
Howard VJ, McClure LA, Glymour MM, et al. Reasons for Geographic and Racial Differences in Stroke (REGARDS). Stroke. 2013.


